A Follow-Up Analysis
MIND Research Institute (MIND) believes in going beyond one good study by carrying out various research to produce repeatable results. While MIND has done this to demonstrate the efficacy of starting to use ST Math, we go a step further by showing what happens when schools stop using ST Math.
In a previous blog, we shared the results of the first study, which showed an increase in math scores in the schools that used ST Math and a subsequent decline in math scores in the same schools after it was removed. This blog covers the results of a second, more rigorous study, further illustrating this trend of decreasing math scores when schools reverted to their “business as usual” math learning environment after ST Math was removed.
In our first study, we observed a group of ST Math users (aggregated across states, years, assessments, grades 3-5) from the year prior to ST Math use, the year during ST Math use, and the year following the removal of ST Math.
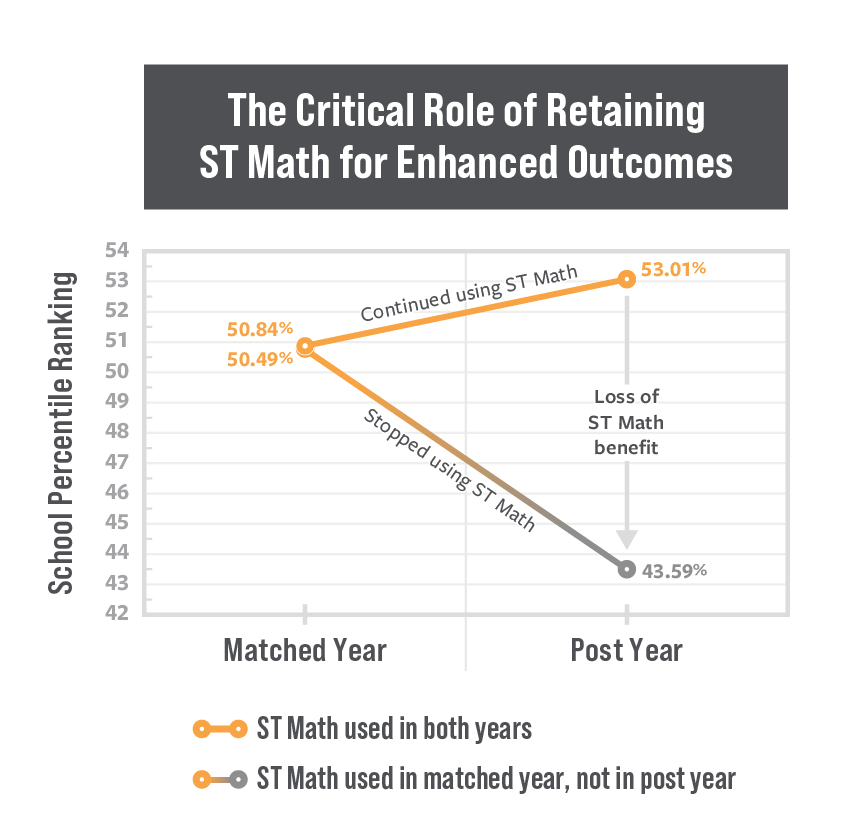
This study analyzes this trend in a new way via a quasi-experimental design (QED) where the treatment condition is the removal of ST Math. Thus, the “treatment” set (TRT) were all ST Math school-grades who used ST Math with fidelity(1) in the “matched” year and were no longer using ST Math in the “post” year. These school-grades were then matched to a “control” set (CTRL) who used ST Math in both the matched and post years with fidelity. The results are clear in the below chart: ST Math users continued to improve while those who stopped using ST Math declined in math performance.
146 grades 3, 4, and 5 at 129 schools in 11 states(2), in addition to the District of Columbia, using ST Math for at least one year between 2006/07 through 2017/18 and all stopped using before 2019/20 (due to COVID-19 pandemic missing data)
Remember, ST Math is rarely removed from schools without being replaced by a competitor edtech product. So, when considering the decline in math performance seen in the treatment set from the matched to post year, this not only shows the loss of efficacy provided by ST Math, but that this drop was substantially more than any potential gains from the new product being implemented.
Comparing the matched year to the post year, the treatment set of school-grades who stopped using ST Math showed a decrease of 6.90% in percentile ranking, while the matched controls who used ST Math in both years showed an increase of 2.17% in percentile ranking. This 9.08% difference between the treatment and control sets is statistically significant.
The treatment and control sets originated from a pool of ST Math users in grades 3-5 with available math standardized testing data(3) and MDR data for demographics. The treatment group included students who used ST Math consistently for a year and then stopped. The control group used ST Math consistently for both years. We matched students in the treatment group with similar students in the control group based on factors like location, grade level, test scores, and the percentage of students receiving free or reduced-price lunch.
It’s important to note that the control pool of ST Math users is significantly smaller than our typical control pool of school-grades having never used ST Math. This led to the loss of many grades in the treatment set due to insufficient matching available. Despite this, the resulting dataset for analysis consisted of 146 school-grades 3, 4, and 5 across 11 states, plus the District of Columbia. The matched year was an aggregate of 06/07 through 17/18, and the post year was an aggregate of 09/10 through 18/19.
Ongoing research can monitor how things are changing in the more recent years following the time when data was missing due to the Covid-19 pandemic. These first two studies only looked at data from before the pandemic to ensure that any changes in math performance weren’t influenced by the disruptions caused by the pandemic.
From what we’ve seen so far, it’s clear that taking ST Math out of schools is not a risk worth taking.
Looking for a new approach to math education that fosters deep understanding and critical thinking, and creates inclusive, engaging learning environments? Discover how MIND’s revolutionary approach to math learning can prepare your students for the challenges of tomorrow.
1 At least 85% student enrollment and at least 40% grade-mean progress completed by April 15
2 Arizona, California, Florida, Iowa, Illinois, Missouri, Nevada, New York, Texas, Virginia, Washington
3 Math scores are normalized by the use of z-scores, and subsequently converted into normalized percentile rankings. This normalization allows comparisons across years, exams, and states.