The ST Math you know and love is all new for the 2020-2021 school year, with exciting and innovative features for students, teachers, and administrators. This new version is here to make more learning happen: while distance learning, in the classroom, or at home.
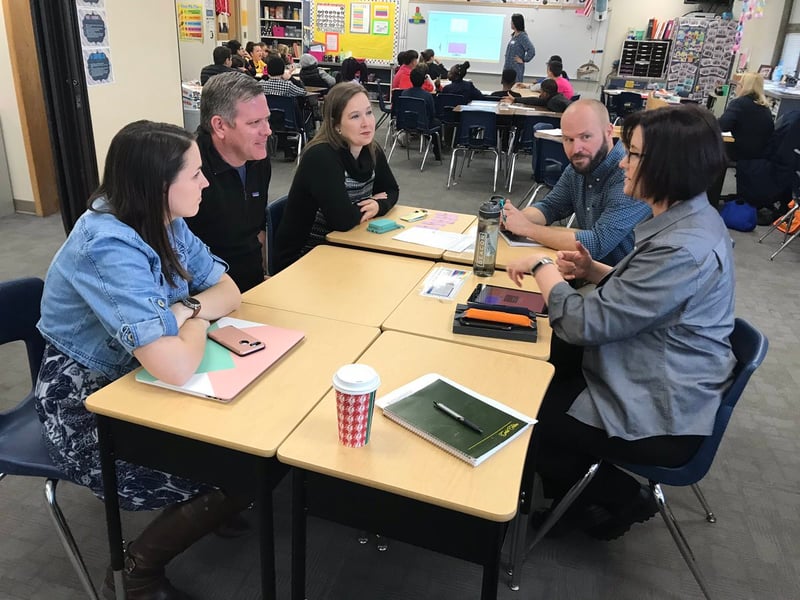
MIND’s Senior User Experience Researcher Alesha Arp sat down to answer our most popular questions, share insight, and research knowledge for users to better understand some of the big changes in this new version of ST Math.
This new version of ST Math focuses on minutes students spend in the program and puzzles collected.
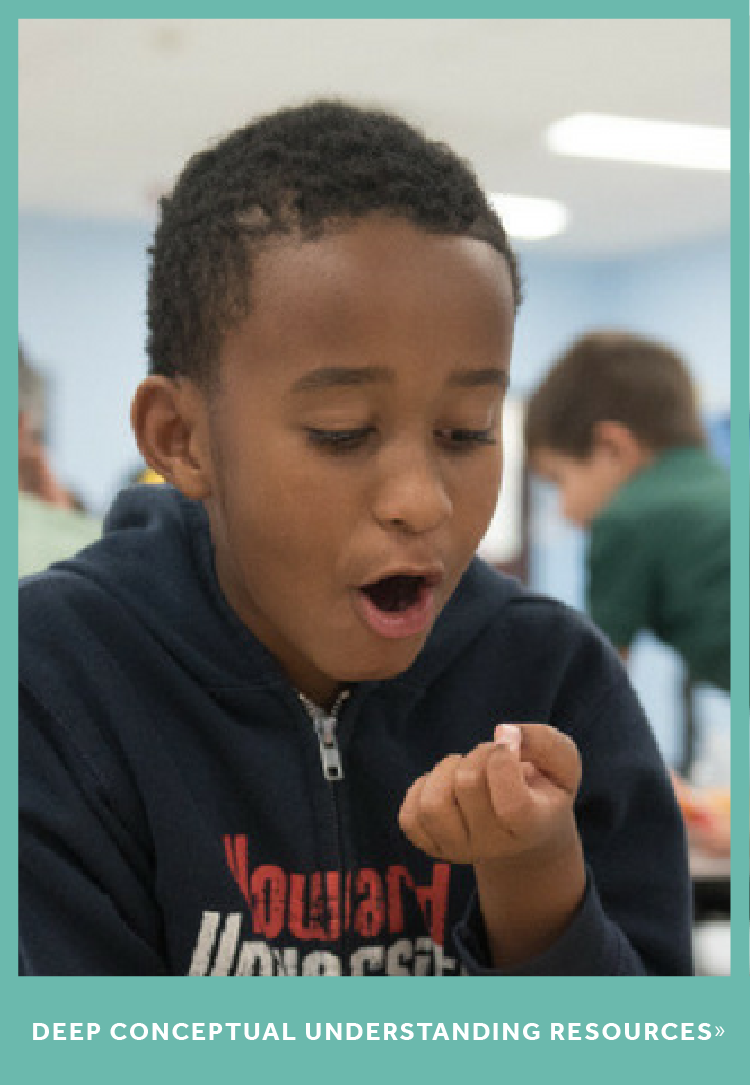
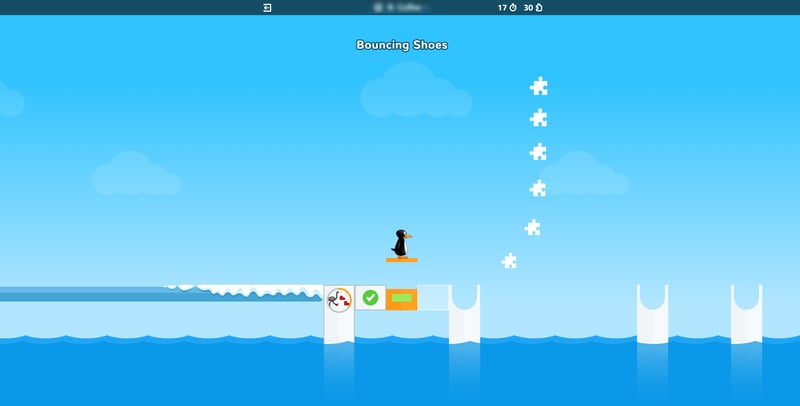 Each math problem is presented as a puzzle for students or solve, students collect puzzles for each level they master.
ST Math has continually improved ever since its inception. Over the years, we have added more games. There are now tens of thousands spread across our PreK-8th grade curriculum.
This sheer volume of content is challenging for a student to complete following the recommended implementation. On some of the more complicated Learning Objectives, which require more game levels to teach a concept, a student might not see their progress percentage advance at all in a week. And when they’re working on a particularly challenging concept, that can be disheartening.
Additionally, with this new version of ST Math, we set out to better empower educators to facilitate students. With a focus on a single large metric like percent progress, a teacher will see a student slip – but it’ll take several sessions before that slip is evident. How many percentage points off an average would a student need to be, before the teacher were to intervene? It’s tough to know.
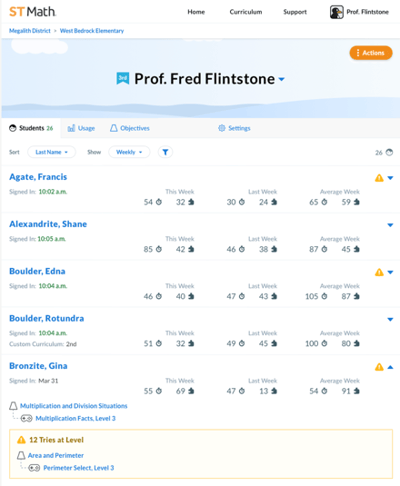
With metrics displayed week by week and available for each student sign-in, a teacher can see a student slip, or surge ahead, the same day it happens. For example, if a teacher asks students to play ST Math for 20 minutes on Tuesday, they’ll see by signing in at the end of that day who put in their time.
Take this one step further and the teacher can see which students are on their expected pace and which are struggling with a concept, or are perhaps not using their time efficiently. Because students work at varying rates, it is expected that their puzzles collected in those 20 minutes will vary, which is why the program shows expected ranges. The teacher may also notice when a student ramps up their pace and is excelling at a concept, or is perhaps getting more help than they should from a peer, sibling, or parent.
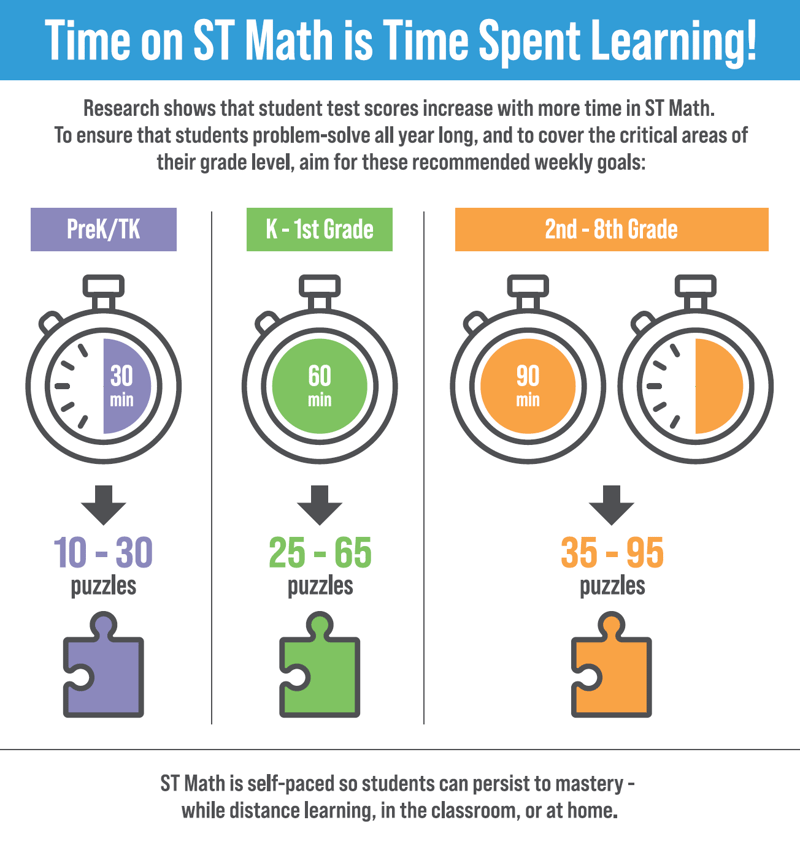
Minutes, Puzzles, and Goal-Setting: Weekly targets useful for setting and monitoring progress toward goals.
Again, students work at their own pace. Some students are thinkers who work through each puzzle in their heads and won’t select an answer until they are relatively sure of their choice. They then use the feedback animation to confirm their thinking.
Others are more willing to quickly hypothesize, choose an answer that seems to complete the puzzle, and then watch the informative feedback to learn why that answer works, or doesn’t. By viewing each student's minutes spent and puzzles collected each week, a teacher will soon notice these pacing differences. Average targets are provided with the student data in the program (pictured above).
Some students might need extra time each week to get through each concept, or only on those concepts that especially challenge them. This will also vary from student to student.
When a student seems to be really, really struggling with a concept, the teacher might want to help scaffold their learning. In the new ST Math that is easy to do by assigning a Learning Objective from a prior grade level, that builds that skill. It can be a great conversation between student and teacher to talk about how concepts build upon each other, and revisiting the building blocks is one way to use those earlier skills. The student might have an “aha moment” and return to the on-grade level Objective quite quickly, or they might need to review the full lower grade level Objective.
A teacher could enrich a student’s learning by assigning a more challenging Objective, perhaps from the next grade level.
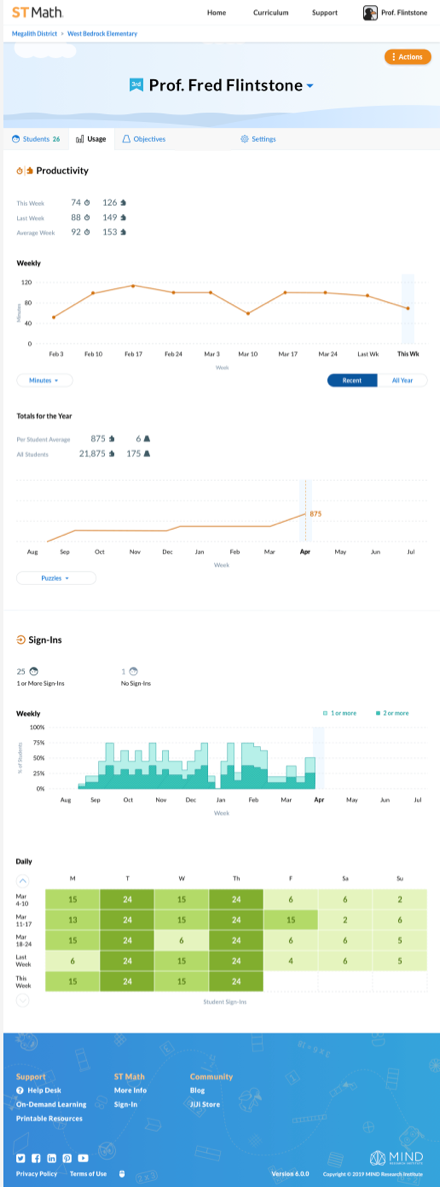
This new reporting structure appears to reflect the school structure with data starting with the individual student, and rolling up to the teacher, to school site administrators and coaches, and on up to district administrators, including curriculum specialists.
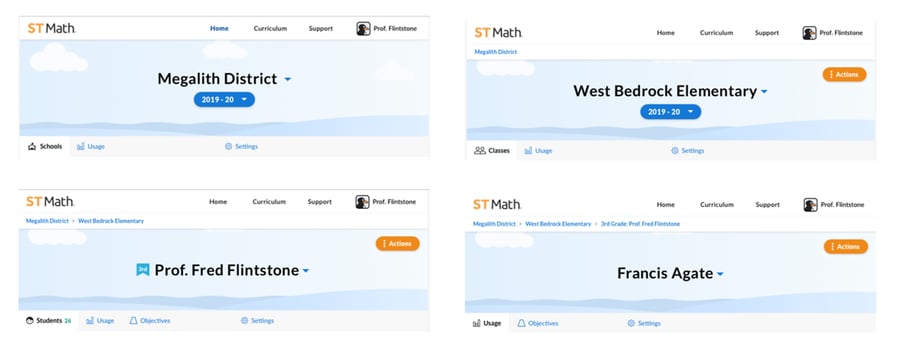
Data is generated by each student and aggregated upwards.
In all our studies back and forth across the country (before the COVID shut-down) administrators at the school and district levels shared that they wanted an easy way to see which schools and which classes were on target, and which were not.
Summary data is available beginning at the school level for district administrators, and at the class level for school site administrators. As we continue to roll out features throughout this school year administrators will gain the ability to dive deeper into more and more granular data. Goals can be tracked and adjusted at the student level on upwards.
Independent studies have shown repeatedly that the magic is in the minutes that students spend engaged in playing ST Math games.
It is about more than efficiency, more than just puzzles per minute. If numbers drop across a class (or a notable number of the students in a class), or across a grade level, a quick look at what content those students are working on could indicate they’ve reached one of those challenging domains for that grade level. Or it could indicate they’ve reached a concept where they need some extra support. Maybe they need to do a group lesson, like a puzzle talk on that concept.
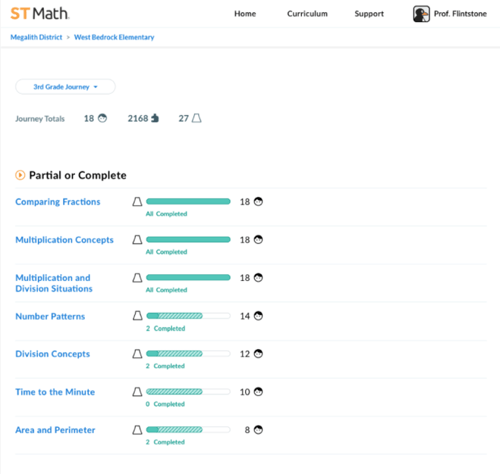 Class data for Learning Objectives
Having the data at a class level will enable educators to check on content covered at milestones throughout the school year. If the expectation is that all students have completed multiplication by a particular point in the year, the above data would let them know that this class was hitting that mark.
 Actionable data is presented first as a high-level summary and gets more
granular the deeper into the program an educator goes.
A program as data rich as ST Math can take time to learn. We designed this version for progressively rich implementations. On day one, the teacher just has to get their kids onto the program to start playing games. They can easily see who was successful, and who has opportunities for improvement.
As the beginning weeks of the school year unfold, teachers and administrators will begin to see trends in their students, classes, and schools. They can act on those trends straight from the summary data at each level, or they can dive deeper and look for broader patterns, isolated issues, peaks and valleys, or where best intentions fall prey to emerging priorities.
The data is actionable at the highest and lowest levels of granularity. When brand new to the program, you can successfully implement using the high level data. As the program becomes more familiar, usage can mature.
In this way, we expect our educators will be able to move from a purely “supplemental program” implementation to a robust “extended instructional” implementation over time. Some schools will get there in year 1 with this new program, while others will mature their implementations more slowly.
The beautiful thing is that effective student learning begins on day one with the simplest implementation acting upon the high level of data.
Across the country, students are expected to learn specific math concepts at each grade level.
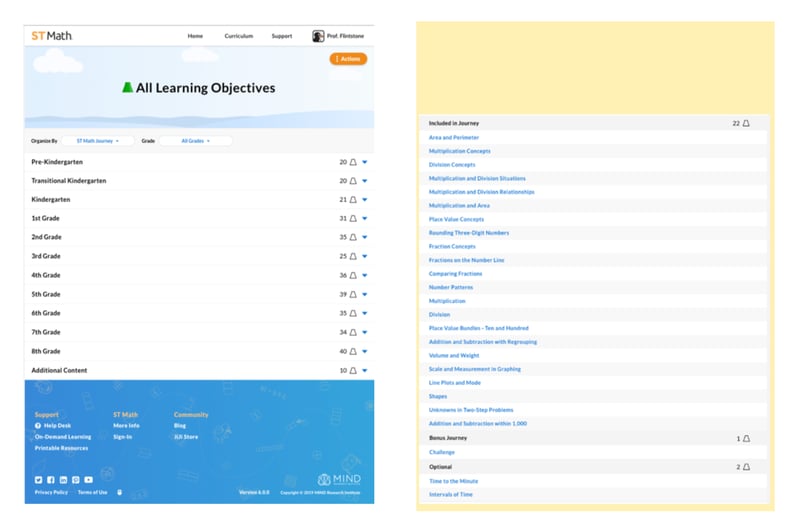
Details about each Learning Objective describe the concepts covered and help educators employ ST Math as a powerful targeted teaching tool.
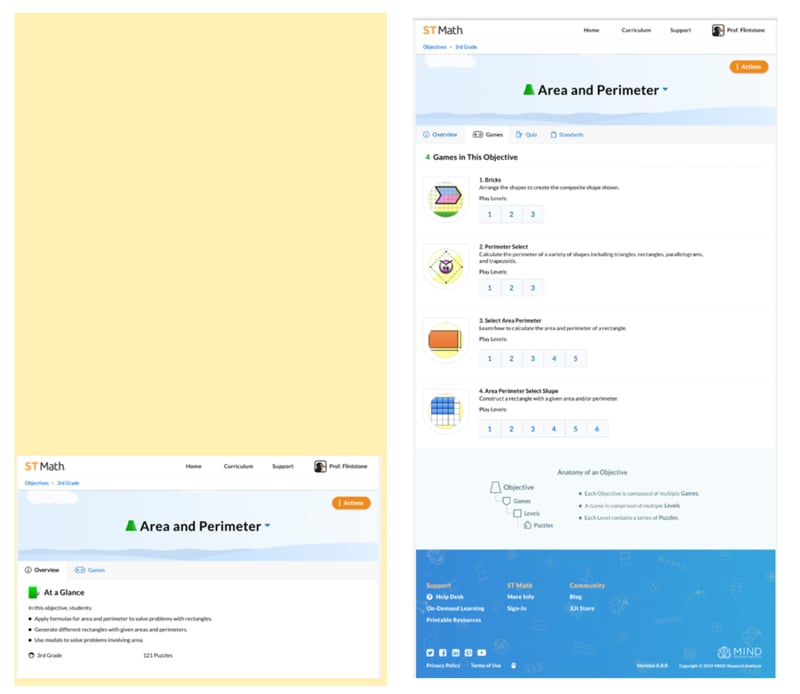
The primary unit of content in ST Math is the Learning Objective. Much like a textbook is made up of chapters, each grade level Journey is made up of Learning Objectives, which are made up of games, made of levels, and made of puzzles. Each puzzle is a math problem for students to solve.
Every Learning Objective in ST Math includes at-a-glance information that tells educators what students will cover. This is especially helpful when a teacher needs to provide intervention or enrichment.
There is also a Games tab for each Objective that gives a brief description of the game, and direct access to each level. When a teacher needs to facilitate a student whose struggle has gone beyond being productive, they can open the exact level the student is playing on their own before conferring with the student.
This feature was also one of the favorites among our Innovation Team schools who beta tested this new version in 2019-20. They found they could easily locate an ST Math game, or even specific level, to teach a kick-off, strategy-sharing, or cap-off lesson for the units they were teaching.
In a program that allows self-paced learning, which is so critical to differentiated learning, this feature enabled teachers to use ST Math as an effective teaching tool to bring students’ focus to the same content in a whole group lesson and then turn the kids loose back on their Journey, or on an assigned Objective in that content area.
This proved especially effective during distance learning because the teacher could share their screen and ask students on their video-conference to share their different strategies. Using the annotation tool and animation controls, the teacher could demonstrate each strategy.
User experience research has been pivotal in informing this new version of ST Math and in changing how we design here at MIND Research Institute. This has been a collaborative effort across every department in the organization.
Our empowerment, partnerships, education success, implementation, and support teammates were right there with us during the research studies, participated in internal studies, and provided incredibly valuable feedback about what worked well and what needed improvement from our prior version.
Our engineering and quality assurance team was working to build a strong, stable technology stack even before the first designs were inked and they have stretched themselves to their limits bringing this design to our schools.
Our data team painstakingly analyzed the data and validated that these metrics would indeed better support student learning and mathematical instruction.
Our R&D team encouraged and pushed this program toward ever higher efficacy and made sure the changes align with the neuroscience that is ST Math’s foundation.
Our content team of mathematicians, graphic artists, and animators have made this program a delightful way for teachers to teach and students to master mathematical concepts.
Our product team leaders have made sure the educator and student experiences are coherent and cohesive and designed according to our resources and timelines.
Our engagement team has shared the story of this design effort in podcasts, blogs, and in our social media feeds. This has helped us inspire more schools to participate in the research and to bring ST Math to their students.
Our social impact team has developed and nurtured key partnerships that have enabled this discovery, design, and development to occur.
Our professional learning and instructional design teams have burned the candle at both ends to get our teachers the training and resources needed to maximize their implementations.
Our leadership and operations team have supported us step-by-step. They have taken this deeper understanding of our partner schools and laid out a roadmap for MIND’s future and our schools’ mathematical competency.
And I’m most proud of my platform design teammates – Theresa Jones, Kris Zalameda, Jennifer Mansdorf, and Justin Templeton, under the patient and conscientious guidance of Paul Blair – who have iterated, and problem-solved, and tested, and gone back to the drawing board, again and again and again and yet again to make more learning happen and to ensure all students are mathematically equipped to solve the world’s most challenging problems.

Alesha Arp is a senior user experience researcher at MIND Research Institute. When she’s not uncovering ways to improve experiences—at work, or IRL—she can often be found baking for family and friends. Homemade cakes are her specialty.


.png)

Comment